Motivation
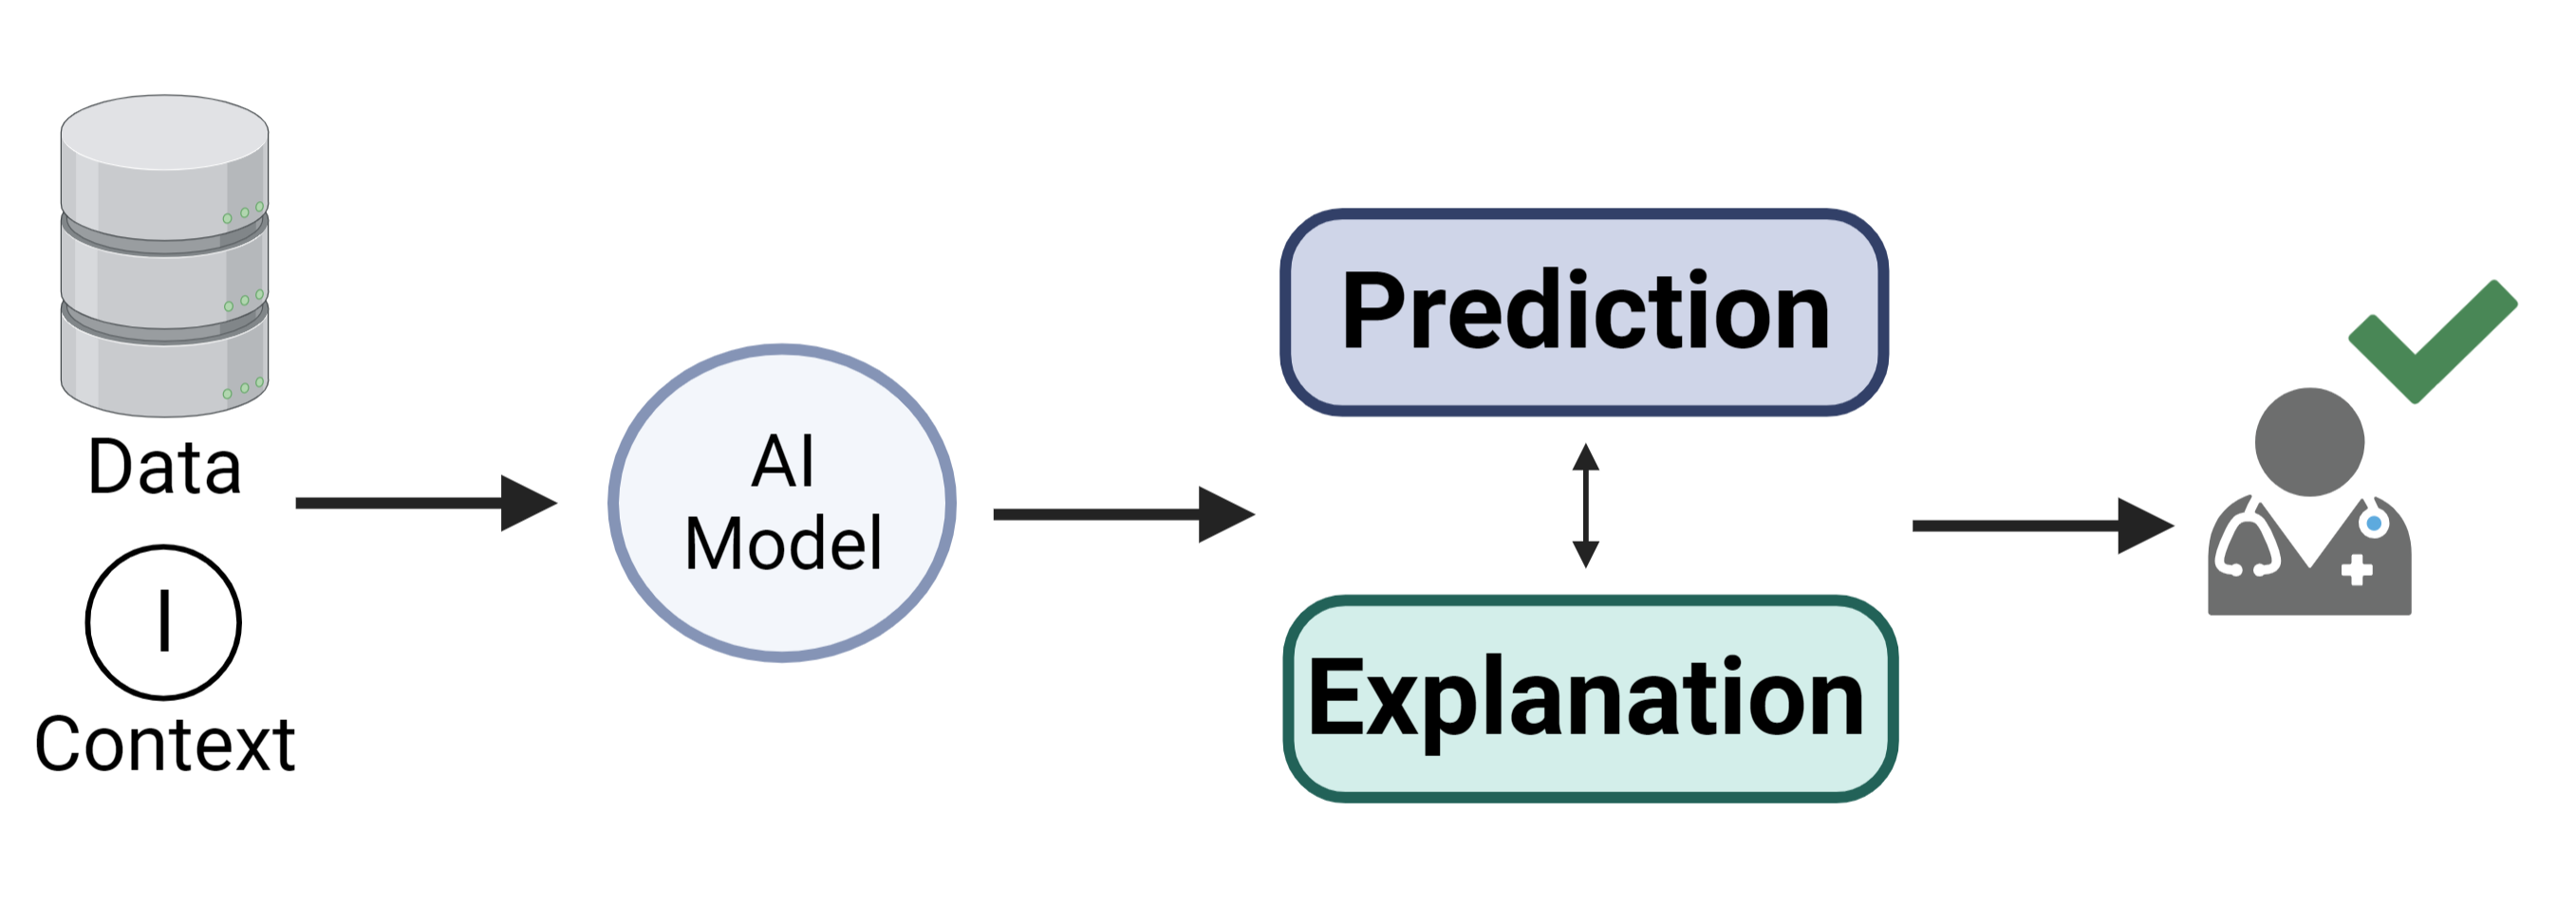
Artificial intelligence (AI) has proven to be incredibly successful in a variety of fields, including the biomedical one. However, one issue is that most advanced AI algorithms are incomprehensible black-box solutions, which means they create useful information without providing any knowledge about their internal workings. This poses significant obstacles, such as explaining a predictive outcome.

One of the historical challenges of AI is explainability. Especially in medicine, explainability can help enhance the trust of physicians in AI systems. To enable explanations, there is a necessity for shared context in much the same way when we understand each other as humans.
So, we need to integrate the data fed to the AI with background knowledge to infer the causality of the AI prediction and generate explanations.

Biomedical Semantic Web technologies represent an unparalleled solution to the problem of human-centric knowledge enabled explanations providing the needed semantic context. They provide large amounts of freely available data in the form of Knowledge Graphs which link data to ontologies.
Objective
Ontologies establish a conceptual model that represents the concepts of a domain and their relationships with one another, in a way that humans and machines can understand.
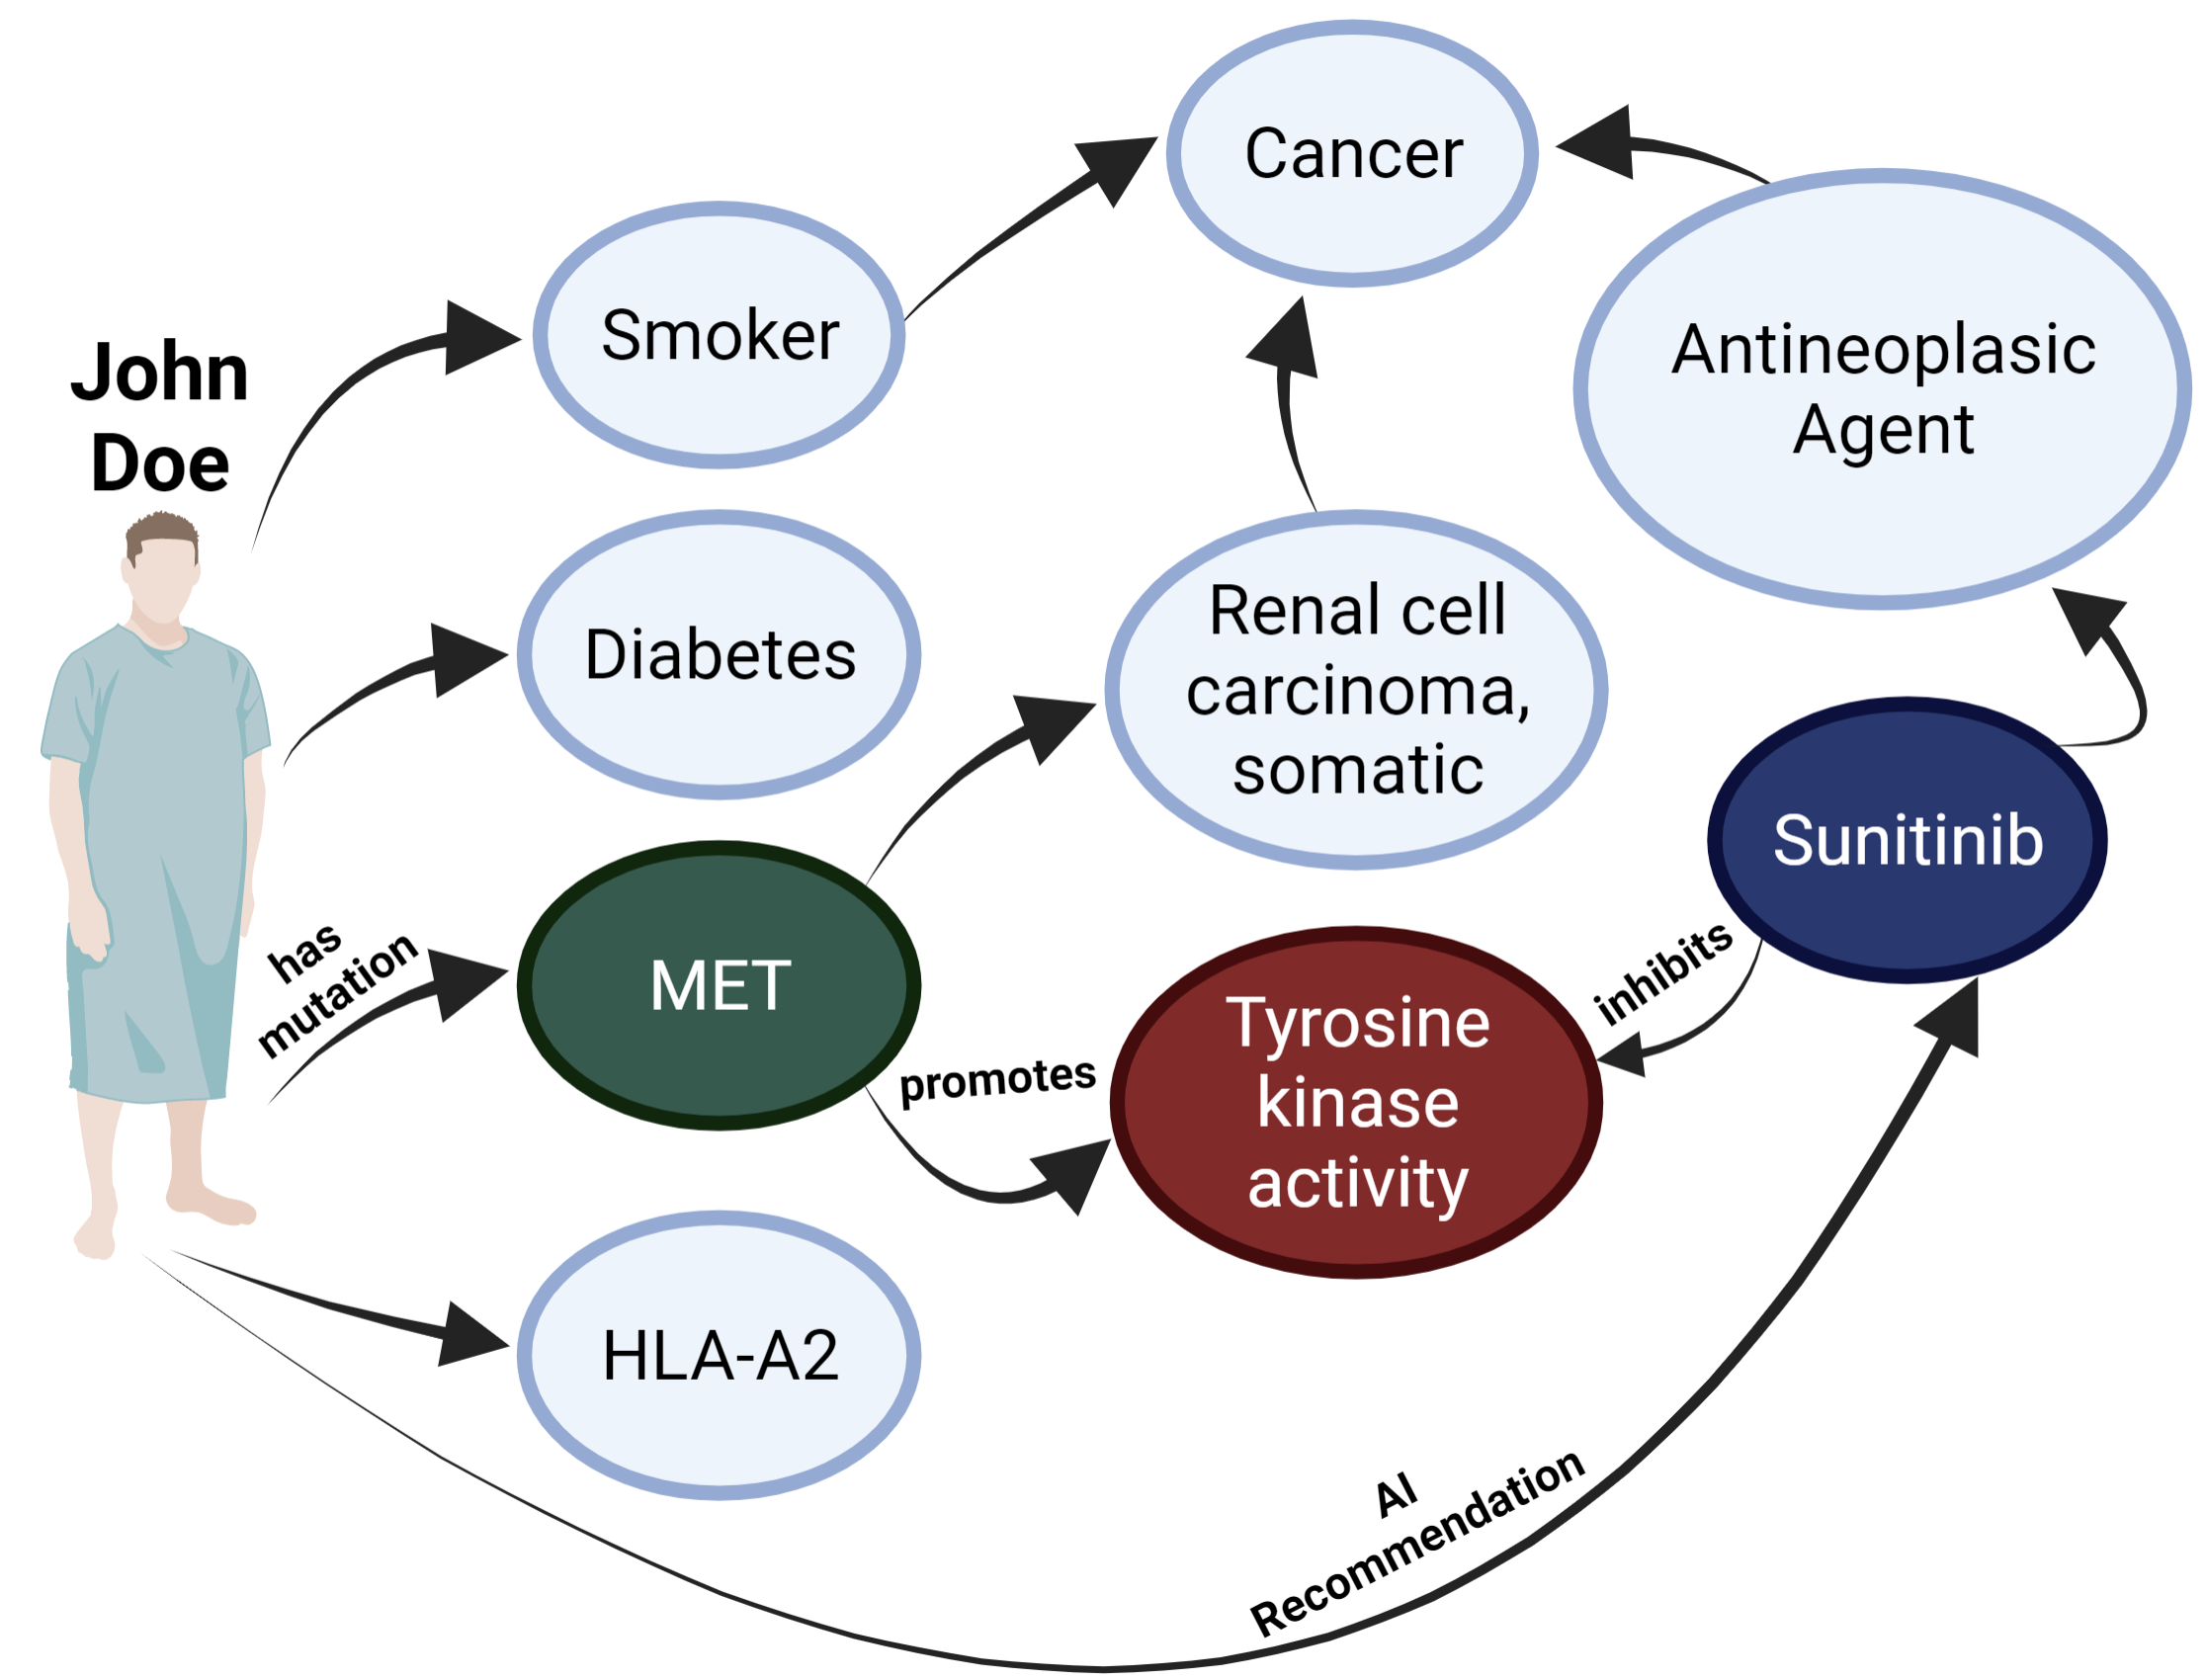
When both input data and AI outcomes are encoded within the Knowledge Graph, it can act as background knowledge for building explanations closer to human conceptualization.
Our main goal is to explain black-box AI methods, performed in personalized oncology, using Knowledge Graphs.
Data
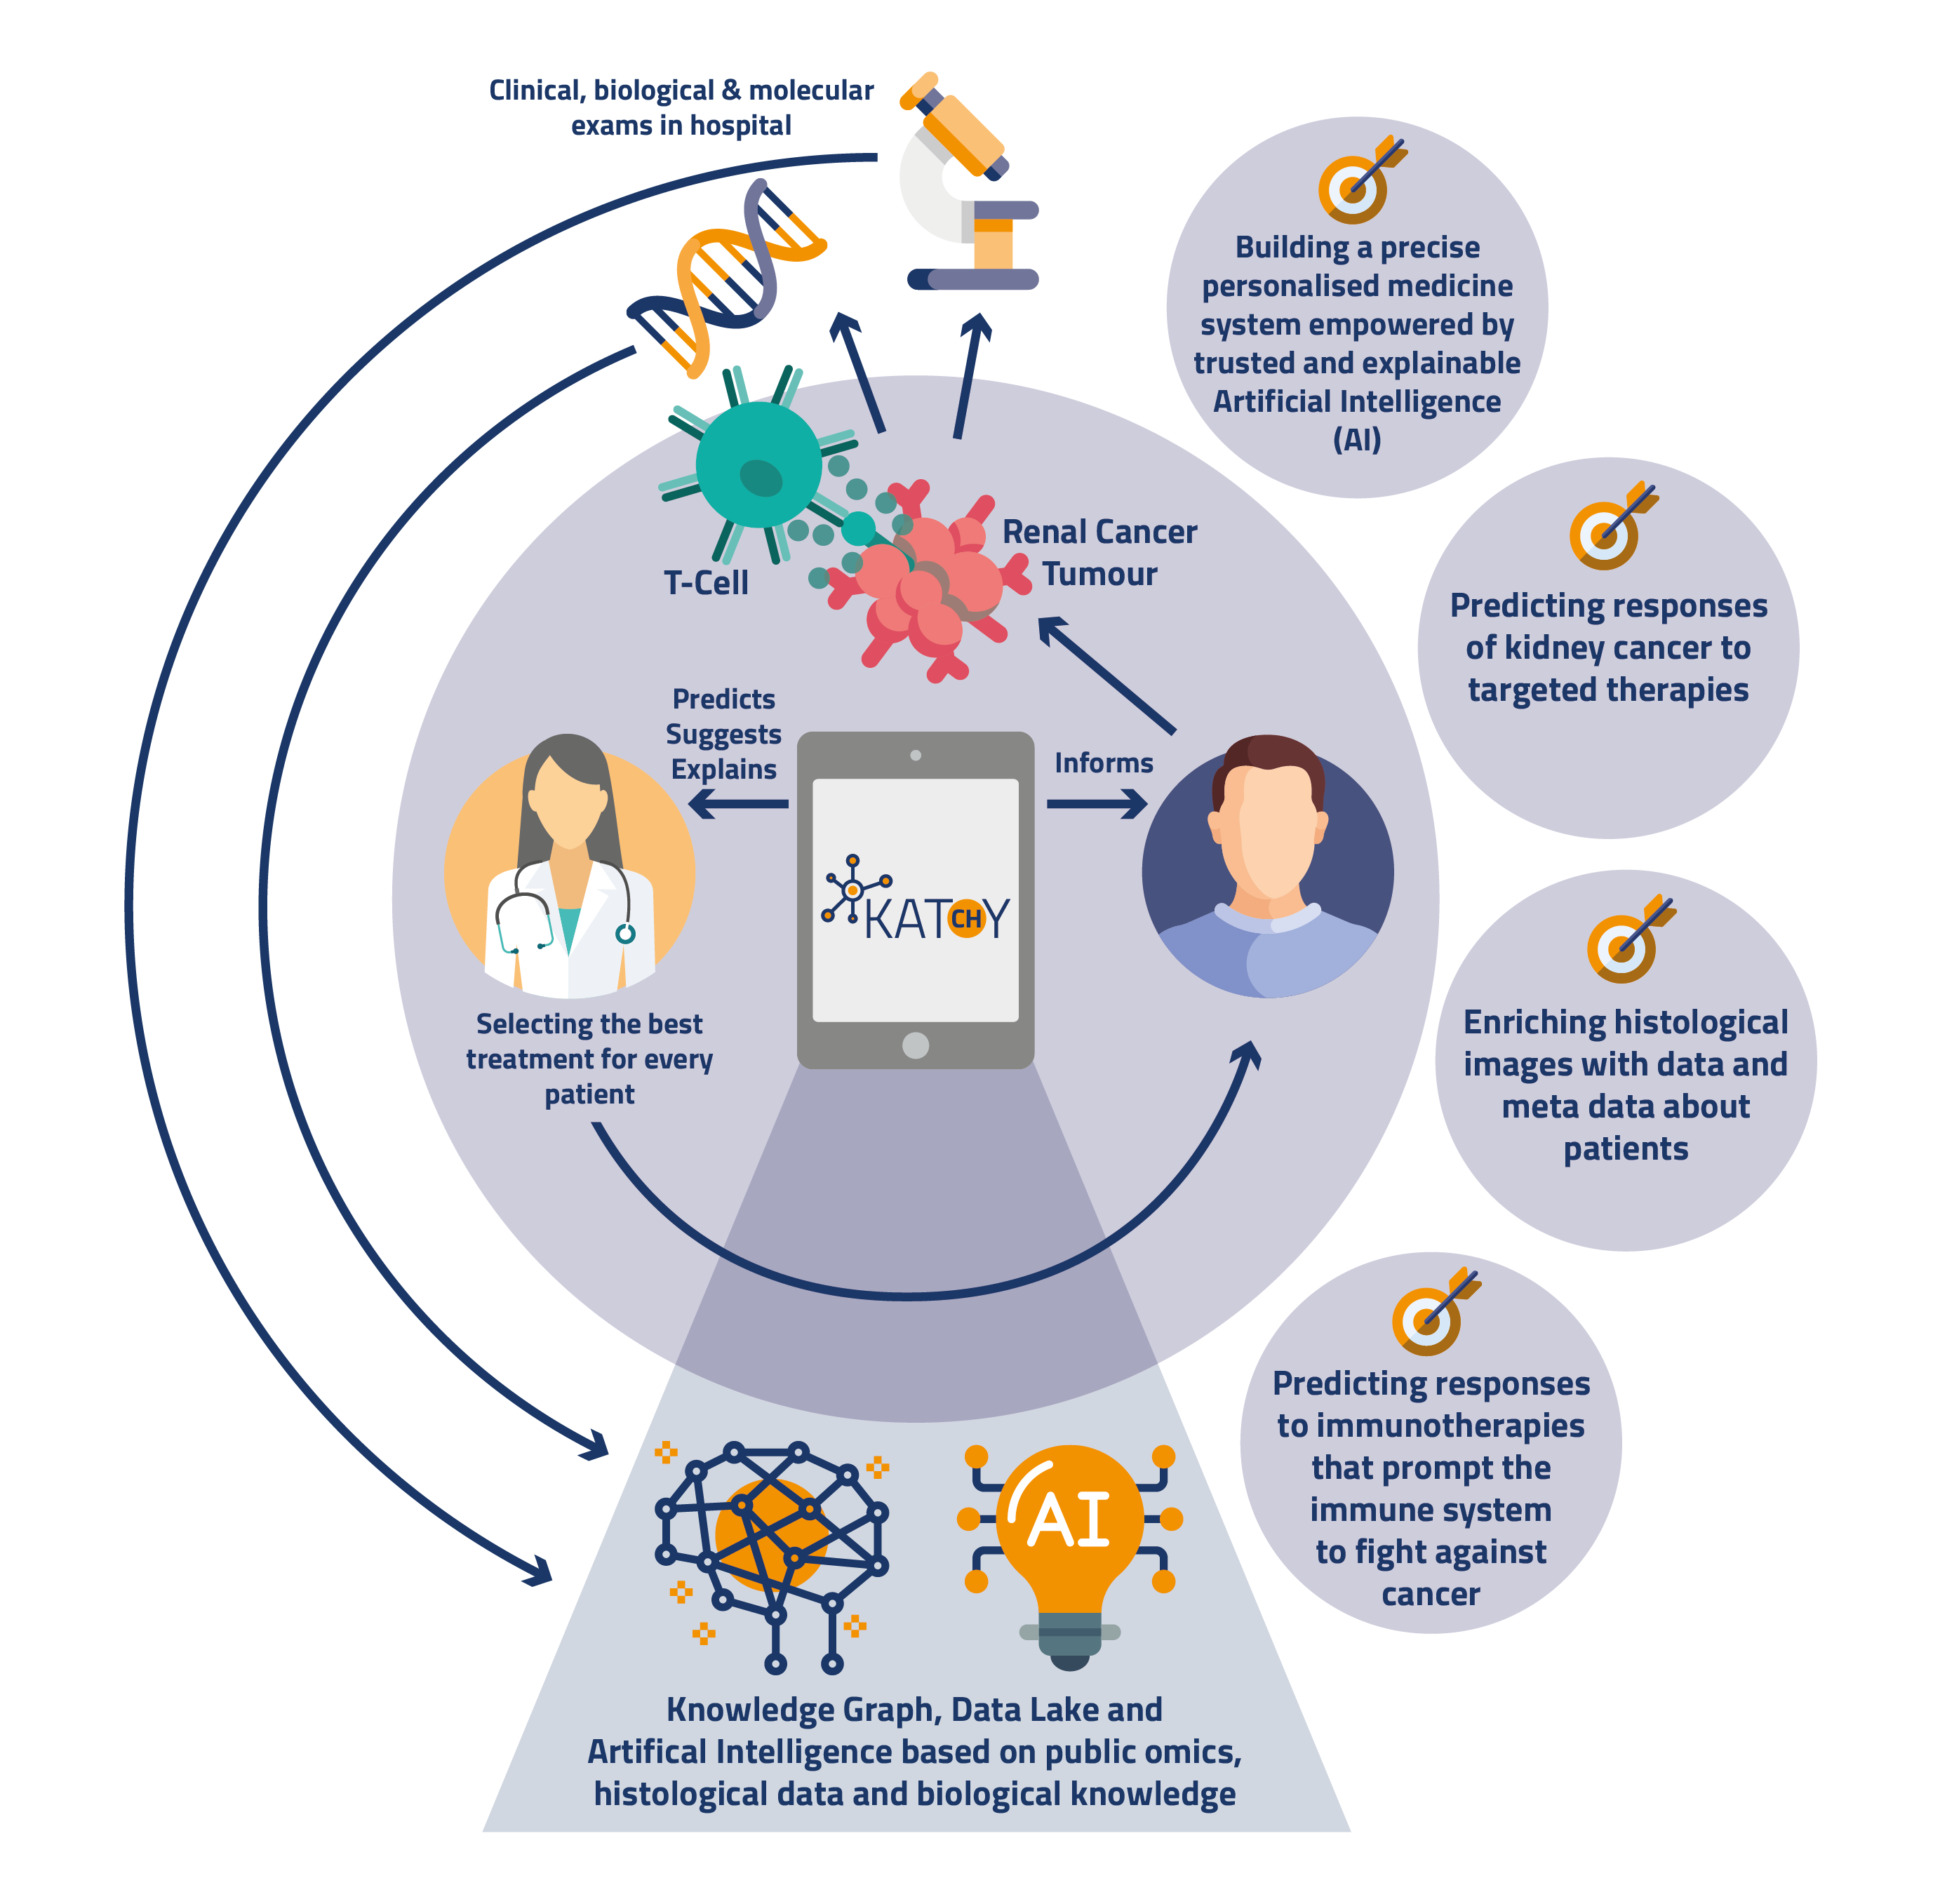
This project is integrated in the european project- Knowledge At the Tip of Your fingers: Clinical Knowledge for Humanity (KATY).
Clinical and biological data from renal cancer patients is gathered by investigators to produce biomedical datasets. This datasets wil be used by AI models to perform predictions.

A knowledge graph containing twenty eight biomedical ontologies integrates the datasets and will be used to generate several types of semantic explanations.
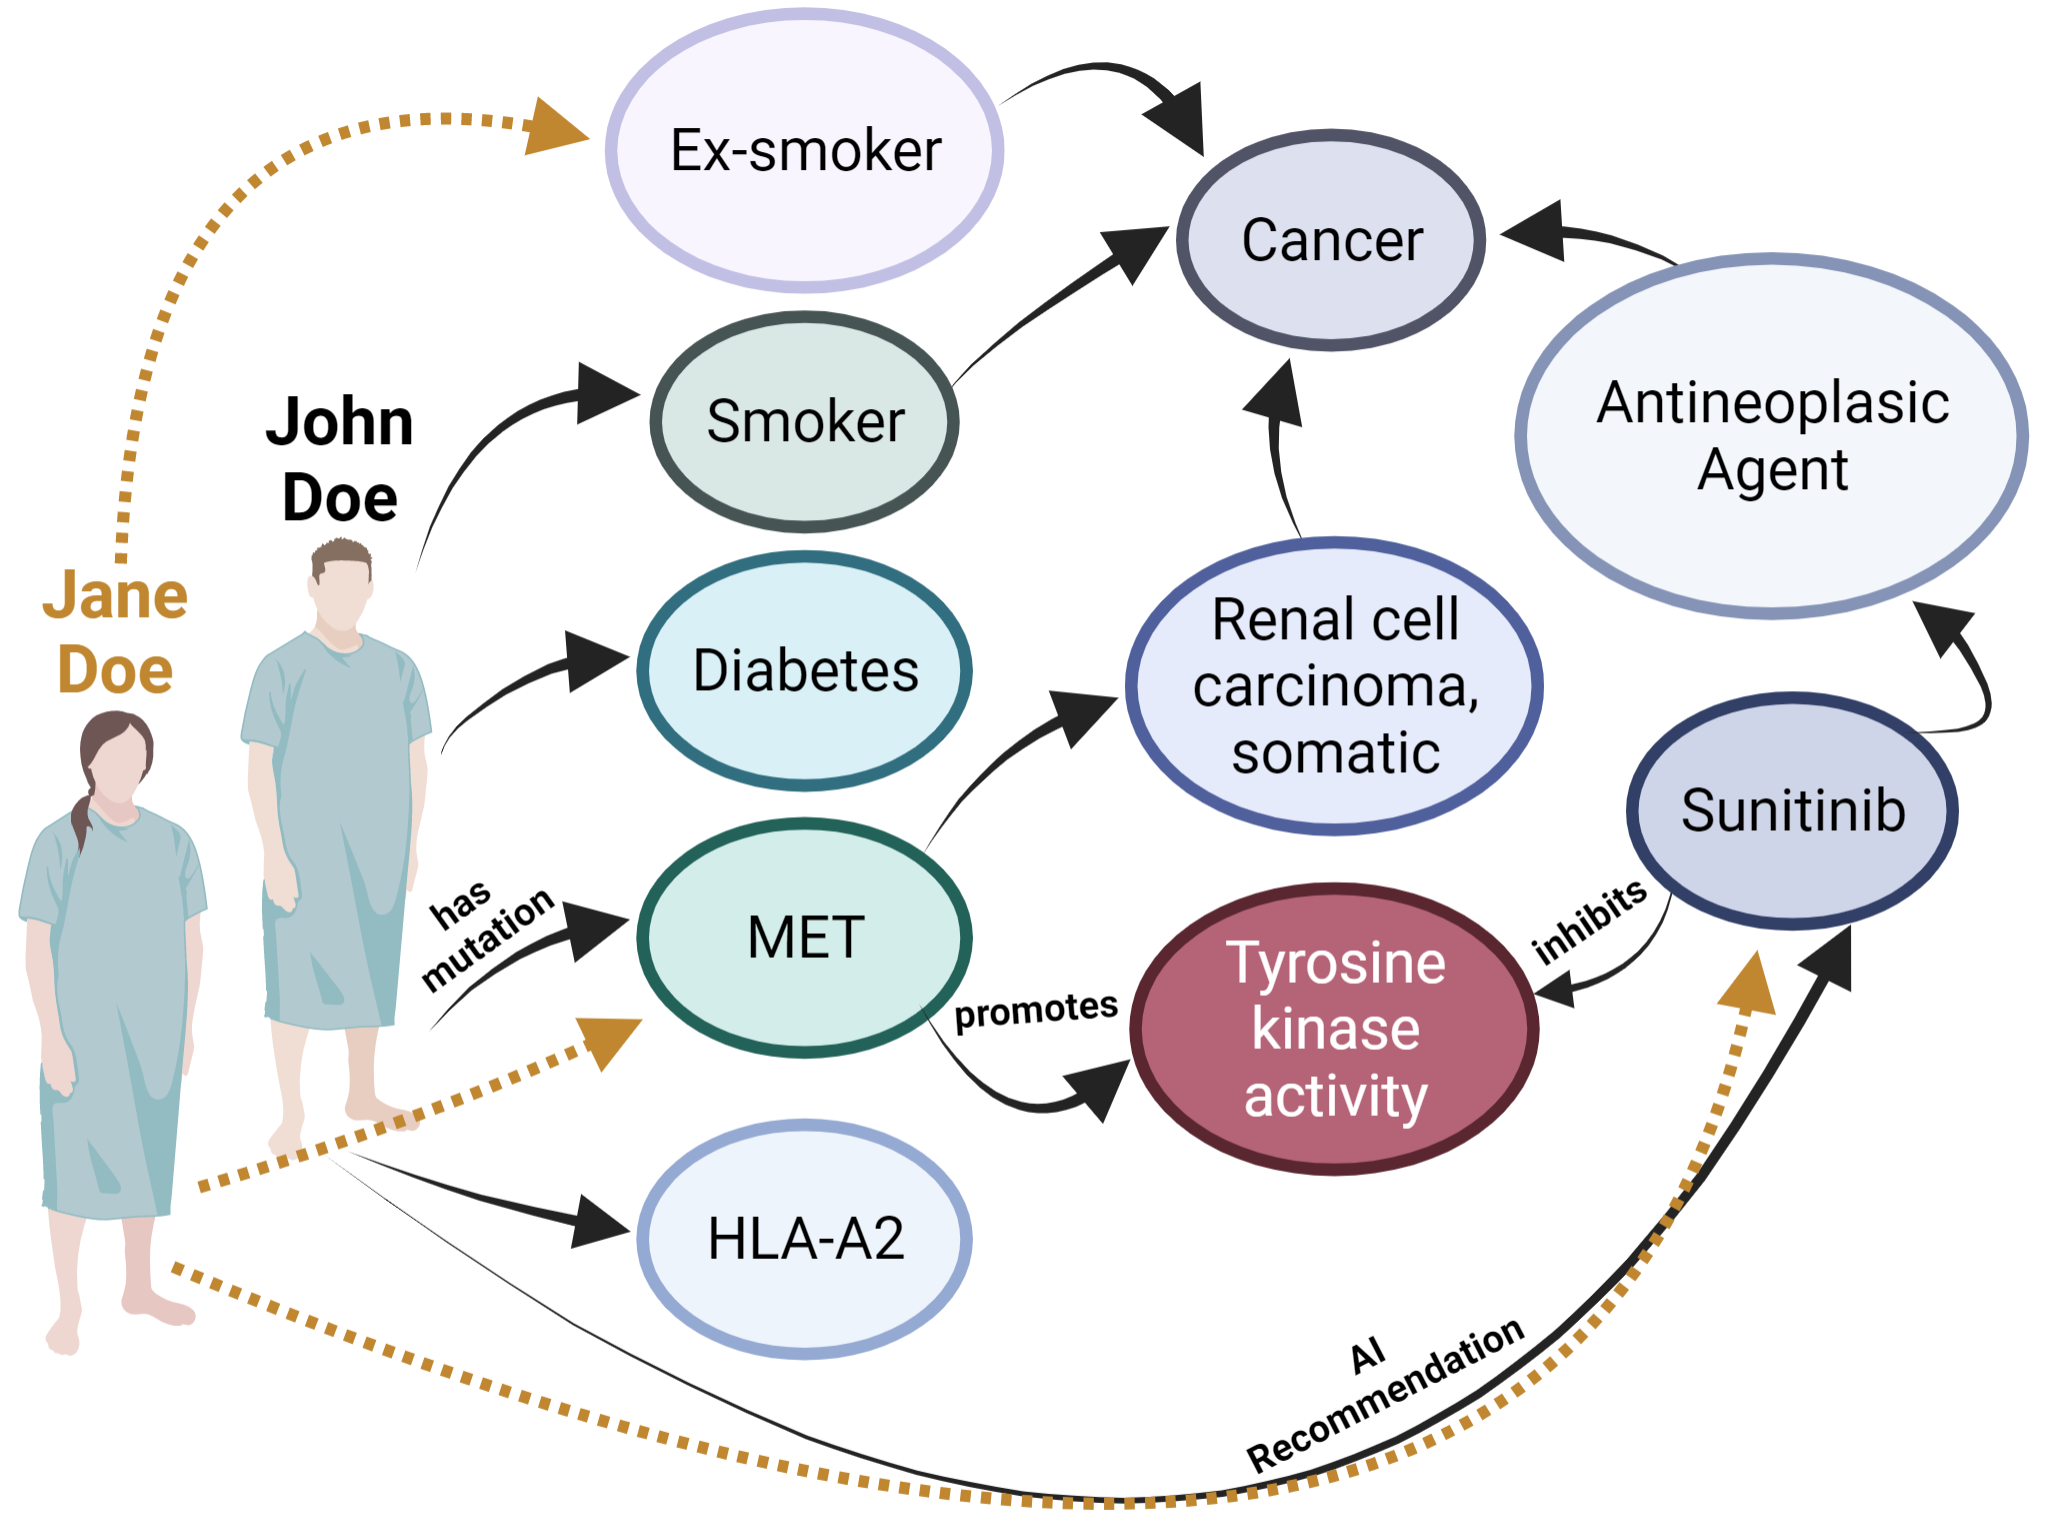
Knowledge Graphs can support Explainable AI
Research Questions
Evaluation
Quantitative Evaluation
Evaluate the scientific correctness of the explanations.
-
Rank explanations
Compare explanations based on semantic similarity.
Qualitative Evaluation
Access the usefulness and usability of the explanations.
-
Perform user studies.
Compare a visualization tool and a written report.
Funding
This work was supported by FCT through the LASIGE Research Unit (UIDB/00408/2020 and UIDP/00408/2020) and by the KATY project which has received funding from the European Union’s Horizon 2020 research and innovation program under grant agreement No 101017453.


